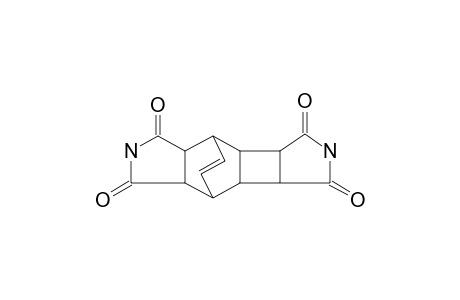
| SpectraBase Compound ID | FkS0F28EZPl |
|---|---|
| InChI | InChI=1S/C14H12N2O4/c17-11-7-3-1-2-4(8(7)12(18)15-11)6-5(3)9-10(6)14(20)16-13(9)19/h1-10H,(H,15,17,18)(H,16,19,20) |
| InChIKey | DRCJGCOYHLTVNR-UHFFFAOYSA-N |
| Mol Weight | 272.26 g/mol |
| Molecular Formula | C14H12N2O4 |
| Exact Mass | 272.079707 g/mol |
Vapor Phase (Gas) Infrared Spectrum
View the Full Spectrum for FREE!
The full spectrum can only be viewed using a FREE account.
| SpectraBase Spectrum ID | Lh1vPVvZ60k |
|---|---|
| Name | Mitindomide |
| Comments | Computed using SmartSpectra Model v1.42 |
| Copyright | Copyright © 2024-2025 John Wiley & Sons, Inc. All Rights Reserved. |
| Exact Mass | 272.079706870 u |
| Formula | C14H12N2O4 |
| InChI | InChI=1S/C14H12N2O4/c17-11-7-3-1-2-4(8(7)12(18)15-11)6-5(3)9-10(6)14(20)16-13(9)19/h1-10H,(H,15,17,18)(H,16,19,20) |
| InChIKey | DRCJGCOYHLTVNR-UHFFFAOYSA-N |
| SMILES | C1(NC(=O)C2C1C1C3C(C2C=C1)C1C3C(NC1=O)=O)=O |
| Spectrum/Structure Validation Score (Vapor Phase IR) | 0.827309 |