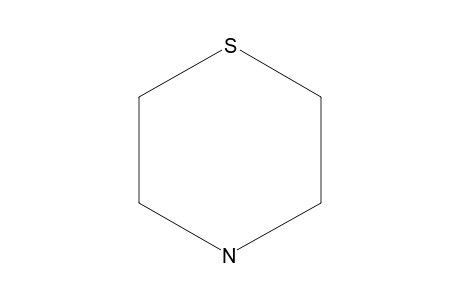
| SpectraBase Compound ID | 3HbDny3AMik |
|---|---|
| InChI | InChI=1S/C4H9NS/c1-3-6-4-2-5-1/h5H,1-4H2 |
| InChIKey | BRNULMACUQOKMR-UHFFFAOYSA-N |
| Mol Weight | 103.18 g/mol |
| Molecular Formula | C4H9NS |
| Exact Mass | 103.04557 g/mol |
13C Nuclear Magnetic Resonance (NMR) Spectrum
View the Full Spectrum for FREE!
The full spectrum can only be viewed using a FREE account.
| SpectraBase Spectrum ID | Lgg0xmrnNcG |
|---|---|
| Name | THIOMORPHOLINE |
| Source of Sample | Fluka AG, Buchs, Switzerland |
| Boiling Point | 175-178C |
| CAS Registry Number | 123-90-0 |
| Copyright | Copyright © 1980, 1981-2025 John Wiley & Sons, Inc. All Rights Reserved. |
| Formula | C4H9NS |
| InChI | InChI=1S/C4H9NS/c1-3-6-4-2-5-1/h5H,1-4H2 |
| InChIKey | BRNULMACUQOKMR-UHFFFAOYSA-N |
| Molecular Weight | 103.19 |
| Solvent | Chloroform-d; Reference=TMS Spectrometer= Varian CFT-20 |