| SpectraBase Spectrum ID |
KzfGP415tFh |
| Name |
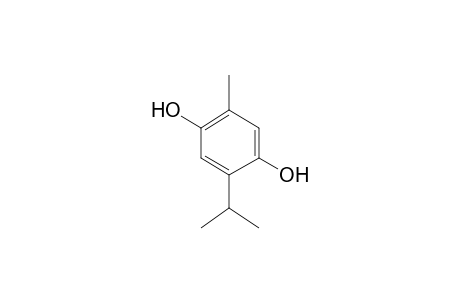
Thymohydroquinone |
| CAS Registry Number |
2217-60-9 |
| Copyright |
Database Compilation Copyright © 2023-2025 John Wiley and Sons, Inc. Copyright © 2023-2025 John Wiley and Sons, Inc., Portions Copyright Wiley-VCH GmbH, Adams Library under license from Diablo Analytical. All Rights Reserved. |
| Exact Mass |
166.099379689 u |
| Formula |
C10H14O2 |
| GC Column |
J&W DB-5 (30 m x 0.25 mm ID x 0.25 μm film thickness) |
| GC Oven Program |
60 °C to 246 °C at 3 °C/min. |
| InChI |
InChI=1S/C10H14O2/c1-6(2)8-5-9(11)7(3)4-10(8)12/h4-6,11-12H,1-3H3 |
| InChIKey |
OQIOHYHRGZNZCW-UHFFFAOYSA-N |
| Molecular Weight |
166.220 g/mol |
| Nominal Mass |
166 u |
| Number of Peaks |
123 |
| SMILES |
Oc1cc(c(cc1C(C)C)O)C |
| SPLASH |
splash10-0udi-3900000000-fda577747cd2cca86980 |
| Source of Spectrum |
Adams' Essential Oil Components (GC-MS), Version 4 |
| Wiley ID |
RA001331 |
