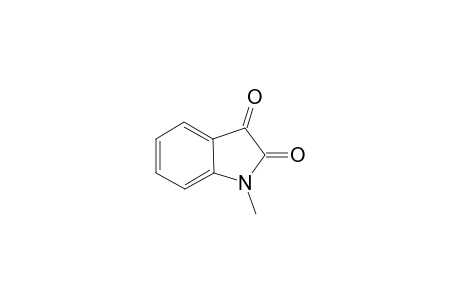
| SpectraBase Compound ID | 4xgexGqLqMe |
|---|---|
| InChI | InChI=1S/C9H7NO2/c1-10-7-5-3-2-4-6(7)8(11)9(10)12/h2-5H,1H3 |
| InChIKey | VCYBVWFTGAZHGH-UHFFFAOYSA-N |
| Mol Weight | 161.16 g/mol |
| Molecular Formula | C9H7NO2 |
| Exact Mass | 161.047678 g/mol |
Mass Spectrum (GC)
View the Full Spectrum for FREE!
The full spectrum can only be viewed using a FREE account.
| SpectraBase Spectrum ID | KFBm5c2KEUT |
|---|---|
| Name | 1-methylindoline-2,3-dione |
| Copyright | Copyright © 2020-2025 John Wiley & Sons, Inc. All Rights Reserved. |
| Formula | C9H7NO2 |
| InChI | InChI=1S/C9H7NO2/c1-10-7-5-3-2-4-6(7)8(11)9(10)12/h2-5H,1H3 |
| InChIKey | VCYBVWFTGAZHGH-UHFFFAOYSA-N |
| Ionization Type | EI |
| Molecular Weight | 161.160 g/mol |
| SMILES | c1ccc2c(c1)C(C(N2C)=O)=O |
| SPLASH | splash10-0w29-0900000000-4e7941c85335722fa414 |
| Source of Spectrum | CN102952061A |
| Wiley ID | 1847094 |