Debug Info
| ||||||
| ||||||
| ||||||
| ||||||
| ||||||
| ||||||
| ||||||
| ||||||
| ||||||
| ||||||
| ||||||
| ||||||
| ||||||
| ||||||
| ||||||
| ||||||
Logged In :
Authorized Features
- None
- DataFullSpectraPoints
- DataReadAll
- DataReportGeneration
- ExportCompound
- ExportStructure
- ExportSpectrum
- ImageFullMS
- ImageHighRes
- ImageFullAxis
- SearchSpectral
- SearchStructure
ADVERTISEMENT
ADVERTISEMENT

| SpectraBase Compound ID | 6TBKSjsqkgQ |
|---|---|
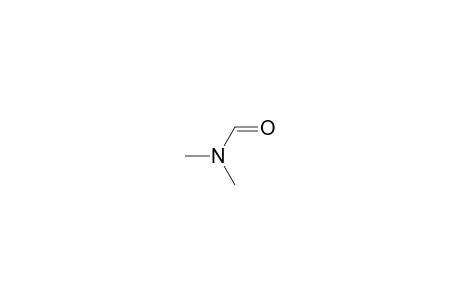
| InChI | InChI=1S/C3H7NO/c1-4(2)3-5/h3H,1-2H3 |
| InChIKey | ZMXDDKWLCZADIW-UHFFFAOYSA-N |
| Mol Weight | 73.09 g/mol |
| Molecular Formula | C3H7NO |
| Exact Mass | 73.052764 g/mol |
ADVERTISEMENT
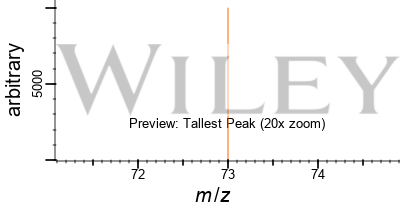
Mass Spectrum (GC)

View the Full Spectrum for FREE!
The full spectrum can only be viewed using a FREE account.
| SpectraBase Spectrum ID | JxQd2jtoyxs |
|---|---|
| Name | N,N-dimethyl formamide |
| Copyright | Copyright © 2020-2025 John Wiley & Sons, Inc. All Rights Reserved. |
| Exact Mass | 73.052763848 u |
| Formula | C3H7NO |
| InChI | InChI=1S/C3H7NO/c1-4(2)3-5/h3H,1-2H3 |
| InChIKey | ZMXDDKWLCZADIW-UHFFFAOYSA-N |
| Ionization Type | EI Positive ion |
| Literature Reference DOI | 10.1002/ejoc.201901195 |
| Molecular Weight | 73.095 g/mol |
| Quality | 941 |
| SMILES | CN(C=O)C |
| SPLASH | splash10-006x-9000000000-1521420df73d637bc6a3 |
| Source of Spectrum | K1-2019-SM5-DMF (DOI: 10.1002/ejoc.201901195) |
| Wiley ID | 1894496 |
ADVERTISEMENT