| SpectraBase Spectrum ID |
JYLs5y23e3C |
| Name |
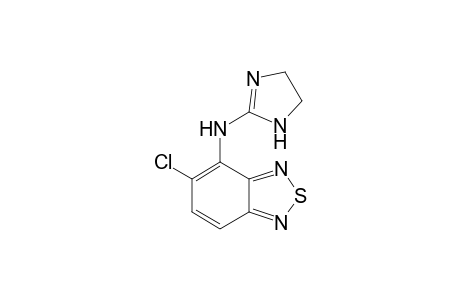
Tizanidine |
| Source of Sample |
Biomol International, L.P. |
| Catalog Number |
Free base of AR-103 |
| Lot Number |
Free base of P3232a |
| Accessory |
DurasamplIR II |
| CAS Registry Number |
51322-75-9 |
| Compound Type |
Pure |
| Copyright |
Copyright © 2012-2025 John Wiley & Sons, Inc. All Rights Reserved. |
| Formula |
C9H8ClN5S |
| InChI |
InChI=1S/C9H8ClN5S/c10-5-1-2-6-8(15-16-14-6)7(5)13-9-11-3-4-12-9/h1-2H,3-4H2,(H2,11,12,13) |
| InChIKey |
XFYDIVBRZNQMJC-UHFFFAOYSA-N |
| Instrument Name |
Bio-Rad FTS |
| Sample Preparation Procedure |
The HCl salt was dissolved in 0.5 ml water in a test tube, and 1 drop of 30% NaOH solution was added, causing the clear solution to turn cloudy white. 1 ml dichloromethane was added to the test tube, which was shaken thoroughly using a vortex mixer. The test tube was spun in a centrifuge to separate the organic and aqueous layers. The bottom organic layer was retrieved with a pipette and placed in another clean test tube. The solvent was evaporated from the tube using a flow of nitrogen gas which resulted in the formation of a solid. |
| Source of Spectrum |
Forensic Spectral Research |
| Technique |
ATR-Neat (DuraSamplIR II) |
