| SpectraBase Spectrum ID |
JG0cAg1dR20 |
| Name |
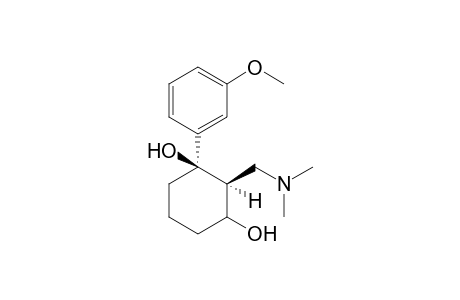
Tramadol-M (OH) |
| Classification |
Pharmaceutical drug metabolite |
| Comments |
Spectrum verified by crosschecking against external libraries (one reference spectrum with similarity >= 99% found); Spectrum verified by independent measurements in external laboratories |
| Copyright |
Copyright © 2024 DigiLab GmbH and Wiley-VCH GmbH. All Rights Reserved. |
| Exact Mass |
279.183443666 u |
| Formula |
C16H25NO3 |
| InChI |
InChI=1S/C16H25NO3/c1-17(2)11-14-15(18)8-5-9-16(14,19)12-6-4-7-13(10-12)20-3/h4,6-7,10,14-15,18-19H,5,8-9,11H2,1-3H3/t14-,15?,16-/m0/s1 |
| InChIKey |
RYYNDUCVHLCZNL-AQOJYXMDSA-N |
| Ionization Type |
Electron Ionization (EI) |
| Molecular Weight |
279.380 g/mol |
| Nominal Mass |
279 u |
| Quality |
910 |
| Retention Index |
2151 |
| SMILES |
OC1[C@@]([C@](CCC1)(C1=CC(=CC=C1)OC)O)(CN(C)C)[H] |
| SPLASH |
splash10-0a4i-9200000000-2772c87a48c5019827ec |
| Sample Comments |
Hydroxyl position uncertain |
| Source of Spectrum |
DigiLab GmbH (C) 2024 |
| Synonyms |
(1R,2S)-2-((dimethylamino)methyl)-1-(3-methoxyphenyl)cyclohexane-1,3-diol |
| Technique |
GC/MS |
| Wiley ID |
DD2024_009342 |
