| SpectraBase Spectrum ID |
IhbF3vKKbG9 |
| Name |
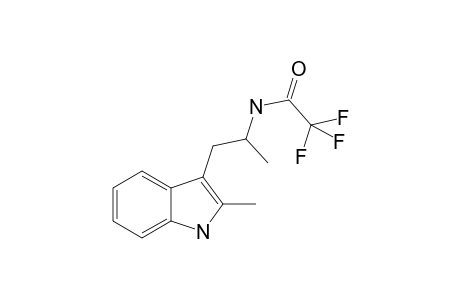
2-Me-AMT TFA |
| Classification |
Designer drug |
| Copyright |
Copyright © 2023-2025 Wiley-VCH GmbH. All Rights Reserved. |
| Exact Mass |
284.113647599 u |
| Formula |
C14H15N2OF3 |
| InChI |
InChI=1S/C14H15F3N2O/c1-8(18-13(20)14(15,16)17)7-11-9(2)19-12-6-4-3-5-10(11)12/h3-6,8,19H,7H2,1-2H3,(H,18,20) |
| InChIKey |
IYFOXPNMZNAZBN-UHFFFAOYSA-N |
| Ionization Type |
Electron Ionization (EI) |
| Molecular Weight |
284.282 g/mol |
| SMILES |
c1ccc2[nH]c(c(CC(NC(=O)C(F)(F)F)C)c2c1)C |
| SPLASH |
splash10-0006-4910000000-7f44bf1879c084026160 |
| Sample Comments |
The MMPW Reference Handbook and associated Tables are attached to Record #1, under the Attachments tab. Refer to these references for an explanation of the Sample Preparation Procedure "Detected" abbreviations, as well as other relevant information pertaining to this database. |
| Source of Spectrum |
H.H.Maurer, M.Meyer, K.Pfleger, A.A. Weber / University of Saarland, D-66424 Homburg Germany |
| Technique |
GC/MS |
| Wiley ID |
MMPW6e_10239 |
