| SpectraBase Spectrum ID |
HI3WXtKxwRq |
| Name |
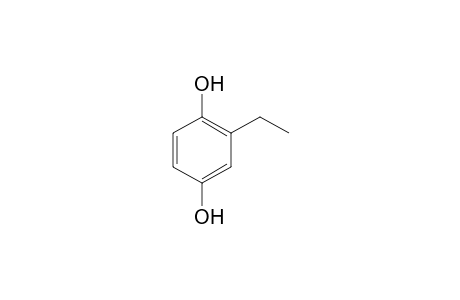
Ethyl quinol |
| Source of Sample |
Indofine Chemical Company, Inc. |
| Catalog Number |
E-003 |
| Lot Number |
94031 |
| CAS Registry Number |
2349-70-4 |
| Compound Type |
Pure |
| Copyright |
Copyright © 2015-2024 John Wiley & Sons, Inc. All Rights Reserved. |
| Formula |
C8H10O2 |
| InChI |
InChI=1S/C8H10O2/c1-2-6-5-7(9)3-4-8(6)10/h3-5,9-10H,2H2,1H3 |
| InChIKey |
VJIDDJAKLVOBSE-UHFFFAOYSA-N |
| Melting Point |
111.0 - 112.0 °C |
| Molecular Weight |
138.166 g/mol |
| Purity |
97% |
| Raman Corrections |
Referenced to internal white light source; 180 degree backscatter |
| Raman Laser Source |
Nd:YAG |
| SMILES |
Oc1ccc(cc1CC)O |
| Source of Spectrum |
Forensic Spectral Research |
| Synonyms |
Ethyl hydroquinone; 1,4-Dihydroxy-2-ethylbenzene |
| Technique |
FT-Raman |
