| SpectraBase Spectrum ID |
FSu6jLr8YQx |
| Name |
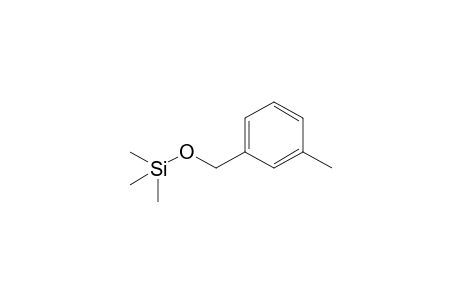
3-Methylbenzylalcohol, 1TMS |
| Comments |
Derivatization type: 1 TMS (mass: 194.113); CC-BY: Oliver Fiehn, University of California, Davis; MoNA-ID: FiehnLib000913; Note: The molecular formula of the structure shown is C8H10O - which differs from the formula reported for the mass spectrum (C11H18OSi) |
| Copyright |
Copyright © 2020-2025 John Wiley & Sons, Inc. All Rights Reserved. |
| Formula |
C11H18OSi |
| InChI |
InChI=1S/C11H18OSi/c1-10-6-5-7-11(8-10)9-12-13(2,3)4/h5-8H,9H2,1-4H3 |
| InChIKey |
YJUMCPQVKCVRMP-UHFFFAOYSA-N |
| Molecular Weight |
194.349 g/mol |
| SMILES |
Cc1cccc(c1)CO[Si](C)(C)C |
| SPLASH |
splash10-0a4i-0900000000-4d250430e2ea2e0308ce |
| Source of Spectrum |
FM-2019-913-0 |
| Synonyms |
m-Tolyl carbinol, 1TMS
3-METHYLBENZYL ALCOHOL, 1TMS
Benzenemethanol, 3-methyl-, 1TMS
ghl.PD_Mitscher_leg0.163, 1TMS
188212_ALDRICH, 1TMS
NSC9397, 1TMS
(3-methylphenyl)methanol, 1TMS
Trimethyl((3-methylbenzyl)oxy)silane |
| Wiley ID |
1818579 |
