| SpectraBase Spectrum ID |
EnhU2X9nykc |
| Name |
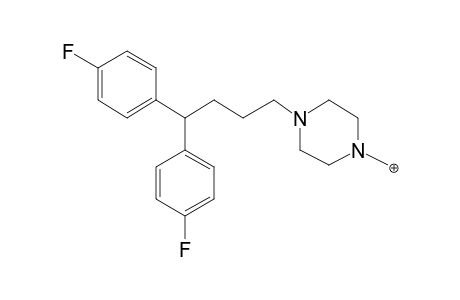
Lidoflazine MS3_1 |
| Comments |
T: ITMS + c ESI d w Full ms3 [email protected] [email protected] [80.00-355.00] |
| Copyright |
Copyright © 2018-2025 Wiley-VCH GmbH. All Rights Reserved. |
| InChI |
InChI=1S/C21H25F2N2/c1-24-13-15-25(16-14-24)12-2-3-21(17-4-8-19(22)9-5-17)18-6-10-20(23)11-7-18/h4-11,21H,1-3,12-16H2/q+1 |
| InChIKey |
BKENGGQXRGSLAO-UHFFFAOYSA-N |
| Ion Polarity |
P |
| Ionization Type |
ESI |
| SMILES |
[CH2+]N1CCN(CC1)CCCC(C=1C=CC(=CC1)F)C=1C=CC(=CC1)F |
| Sample Comments |
The MWW Reference Handbook and associated table are attached to Record #1, under the Attachments tab. Refer to these references for the sample preparation procedure and abbreviations, as well as other relevant information pertaining to this database. |
| Sample Description |
Analyte Type: Parent |
| Source of Spectrum |
Maurer/Wissenbach/Weber, Saarland University |
| Spectrum Type |
ms3 |
| Technique |
ITMS |
