| SpectraBase Spectrum ID |
EFAohtYm8J6 |
| Name |
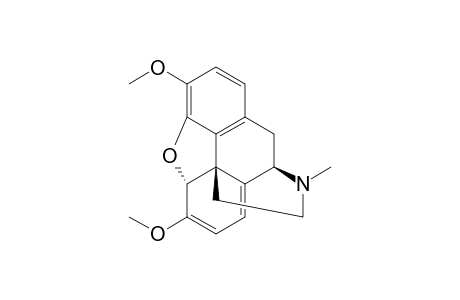
Thebaine |
| Source of Sample |
Alltech Associates, Inc., Grace Davison Discovery Sciences |
| Catalog Number |
01807 |
| Lot Number |
491 |
| Apodization Function |
Triangular |
| CAS Registry Number |
115-37-7 |
| Copyright |
Copyright © 2012-2024 John Wiley & Sons, Inc. All Rights Reserved. |
| DEA Schedule |
II |
| Formula |
C19H21NO3 |
| InChI |
InChI=1S/C19H21NO3/c1-20-9-8-19-12-5-7-15(22-3)18(19)23-17-14(21-2)6-4-11(16(17)19)10-13(12)20/h4-7,13,18H,8-10H2,1-3H3/t13-,18+,19+/m1/s1 |
| InChIKey |
FQXXSQDCDRQNQE-VMDGZTHMSA-N |
| Instrument Name |
Bio-Rad FTS
|
| SMILES |
c12c3c(ccc1C[C@@]1(\C4=C\C=C/([C@@]([C@]24CCN1C)(O3)[H])OC)[H])OC |
| Scan Speed (number) |
5 |
| Source of Spectrum |
Forensic Spectral Research |
| Technique |
KBr0 |
