| SpectraBase Spectrum ID |
DmyOYMLPN5c |
| Name |
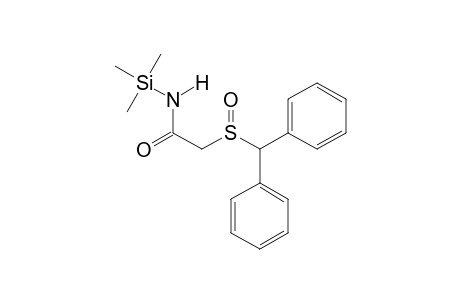
Modafinil TMS |
| Classification |
Pharmaceutical drug derivative |
| Comments |
Spectrum verified by independent measurements in external laboratories |
| Copyright |
Copyright © 2024-2025 DigiLab GmbH and Wiley-VCH GmbH. All Rights Reserved. |
| Exact Mass |
345.121876692 u |
| Formula |
C18H23NO2SSi |
| InChI |
InChI=1S/C18H23NO2SSi/c1-23(2,3)19-17(20)14-22(21)18(15-10-6-4-7-11-15)16-12-8-5-9-13-16/h4-13,18H,14H2,1-3H3,(H,19,20) |
| InChIKey |
SCQSDUMEPKUAJL-UHFFFAOYSA-N |
| Ionization Type |
Electron Ionization (EI) |
| Molecular Weight |
345.532 g/mol |
| Nominal Mass |
345 u |
| Quality |
987 |
| Retention Index |
2426 |
| SMILES |
C(C1=CC=CC=C1)(C1=CC=CC=C1)S(CC(N[Si](C)(C)C)=O)=O |
| SPLASH |
splash10-014j-1900000000-af385fd8d2feda711912 |
| Source of Spectrum |
DigiLab GmbH (C) 2024 |
| Synonyms |
((diphenylmethyl)sulfinyl)-N-(trimethylsilyl)acetamide |
| Technique |
GC/MS |
| Wiley ID |
DD2024_027502 |
