| SpectraBase Spectrum ID |
BjM0j5UTte3 |
| Name |
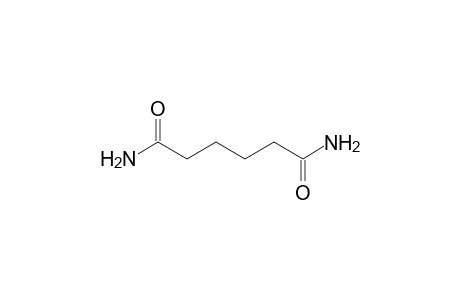
Adipamide |
| Source of Sample |
Spectrochem Pvt. Ltd., India |
| Catalog Number |
10195 |
| CAS Registry Number |
628-94-4 |
| Copyright |
Copyright © 2014-2024 John Wiley & Sons, Inc. All Rights Reserved. |
| Formula |
C6H12N2O2 |
| InChI |
InChI=1S/C6H12N2O2/c7-5(9)3-1-2-4-6(8)10/h1-4H2,(H2,7,9)(H2,8,10) |
| InChIKey |
GVNWZKBFMFUVNX-UHFFFAOYSA-N |
| Instrument Name |
Bruker MultiRAM Stand Alone FT-Raman Spectrometer |
| Physical State |
Solid |
| Purity |
>98% |
| Raman Corrections |
Referenced to internal white light source; Scattering corrected |
| Raman Laser Source |
Nd:YAG |
| Sample Type |
Organic |
| Source of Spectrum |
Bio-Rad Laboratories |
| Synonyms |
Hexanediamide |
| Technique |
FT-Raman |
