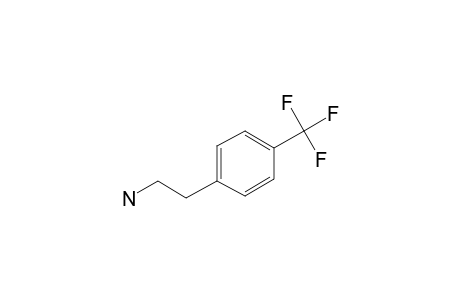
| SpectraBase Compound ID | EQVM2eaM2dc |
|---|---|
| InChI | InChI=1S/C9H10F3N/c10-9(11,12)8-3-1-7(2-4-8)5-6-13/h1-4H,5-6,13H2 |
| InChIKey | HMFOBPNVAAAACP-UHFFFAOYSA-N |
| Mol Weight | 189.18 g/mol |
| Molecular Formula | C9H10F3N |
| Exact Mass | 189.076534 g/mol |
Vapor Phase (Gas) Infrared Spectrum
View the Full Spectrum for FREE!
The full spectrum can only be viewed using a FREE account.
| SpectraBase Spectrum ID | 9qRvzDk8s2t |
|---|---|
| Name | 2-(4-Trifluoromethylphenyl)ethylamine |
| Comments | Computed using SmartSpectra Model v1.42 |
| Copyright | Copyright © 2024-2025 John Wiley & Sons, Inc. All Rights Reserved. |
| Exact Mass | 189.076533815 u |
| Formula | C9H10F3N |
| InChI | InChI=1S/C9H10F3N/c10-9(11,12)8-3-1-7(2-4-8)5-6-13/h1-4H,5-6,13H2 |
| InChIKey | HMFOBPNVAAAACP-UHFFFAOYSA-N |
| Molecular Weight | 189.181 g/mol |
| SMILES | C(F)(F)(F)C1=CC=C(C=C1)CCN |
| Spectrum/Structure Validation Score (Vapor Phase IR) | 0.86987 |