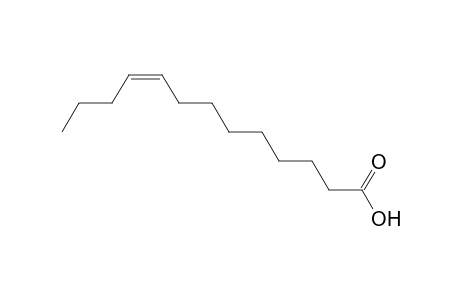
| SpectraBase Compound ID | 3wwtRkJQSZJ |
|---|---|
| InChI | InChI=1S/C13H24O2/c1-2-3-4-5-6-7-8-9-10-11-12-13(14)15/h4-5H,2-3,6-12H2,1H3,(H,14,15)/b5-4- |
| InChIKey | KIWIPIAOWPKUNM-PLNGDYQASA-N |
| Mol Weight | 212.33 g/mol |
| Molecular Formula | C13H24O2 |
| Exact Mass | 212.17763 g/mol |
Mass Spectrum (LC)
View the Full Spectrum for FREE!
The full spectrum can only be viewed using a FREE account.
| SpectraBase Spectrum ID | 9olqtV6Lhqy |
|---|---|
| Name | FA 13:1 |
| Classification | Fatty acyls [FA] |
| Comments | Free fatty acid |
| Copyright | Copyright © 2025 John Wiley & Sons, Inc. All Rights Reserved. |
| Exact Mass | 212.177630011 u |
| Formula | C13H24O2 |
| InChI | InChI=1S/C13H24O2/c1-2-3-4-5-6-7-8-9-10-11-12-13(14)15/h4-5H,2-3,6-12H2,1H3,(H,14,15)/b5-4- |
| InChIKey | KIWIPIAOWPKUNM-PLNGDYQASA-N |
| Ion Polarity | N |
| Literature Reference | Tsugawa, H.; Ikeda, K.; Takahashi, M.; Satoh, A.; Mori, Y.; Uchino, H.; Okahashi, N.; Yamada, Y.; Tada, I.; Bonini, P.; Higashi, Y.; Okazaki, Y.; Zhou, Z.; Zhu, Z.-J.; Koelmel, J.; Cajka, T.; Fiehn, O.; Saito, K.; Arita, M.; Arita, M. A Lipidome Atlas in MS-DIAL 4. Nature Biotechnology 2020, 38 (10), 1159–1163. |
| Literature Reference DOI | https://doi.org/10.1038/s41587-020-0531-2 |
| Precursor Ion | [M-H]- |
| SMILES | CCC\C=C/CCCCCCCC(O)=O |
| Sample Comments | theoretical MS2 created from the information of SCIEX 5600 and 6600 with 45CE +-15CES |