| SpectraBase Spectrum ID |
8oHq9bcriwZ |
| Name |
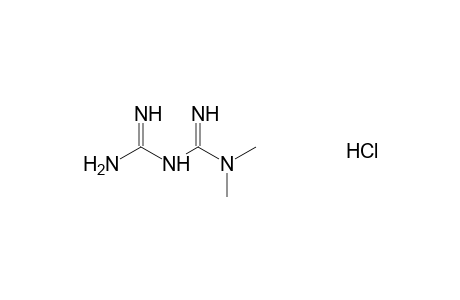
Metformin HCl |
| Source of Sample |
Alltech Associates, Inc., Grace Davison Discovery Sciences |
| Catalog Number |
01615 |
| Lot Number |
428 |
| CAS Registry Number |
1115-70-4 |
| Classification |
anti-diabetic |
| Copyright |
Copyright © 2013-2024 John Wiley & Sons, Inc. All Rights Reserved. |
| Formula |
C4H12ClN5 |
| InChI |
InChI=1S/C4H11N5.ClH/c1-9(2)4(7)8-3(5)6;/h1-2H3,(H5,5,6,7,8);1H |
| InChIKey |
OETHQSJEHLVLGH-UHFFFAOYSA-N |
| Raman Corrections |
Referenced to internal white light source; 180 Degree backscatter |
| Raman Laser Source |
Nd:YAG |
| Sadtler IR Number |
DW0077 |
| Source of Spectrum |
Forensic Spectral Research |
| Synonyms |
Glucophage; 1,1-Dimethylbiguanide, hydrochloride |
| Technique |
FT-Raman |
