| SpectraBase Spectrum ID |
2o0PtAnix1c |
| Name |
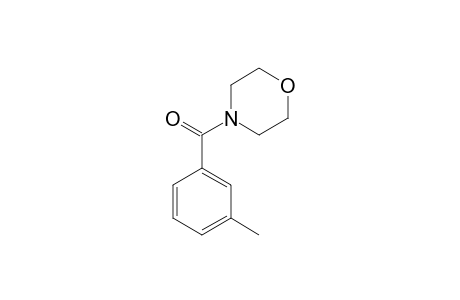
N-(3-Methylbenzoyl)morpholine |
| Classification |
Chemical |
| Comments |
Spectrum verified by crosschecking against external libraries (one reference spectrum with similarity >= 99% found) |
| Copyright |
Copyright © 2024-2025 DigiLab GmbH and Wiley-VCH GmbH. All Rights Reserved. |
| Exact Mass |
205.110278725 u |
| Formula |
C12H15NO2 |
| InChI |
InChI=1S/C12H15NO2/c1-10-3-2-4-11(9-10)12(14)13-5-7-15-8-6-13/h2-4,9H,5-8H2,1H3 |
| InChIKey |
OFWPQEAIAAQOOJ-UHFFFAOYSA-N |
| Ionization Type |
Electron Ionization (EI) |
| Molecular Weight |
205.257 g/mol |
| Nominal Mass |
205 u |
| Quality |
992 |
| Retention Index |
1787 |
| SMILES |
C1(C(N2CCOCC2)=O)=CC(=CC=C1)C |
| SPLASH |
splash10-014l-7930000000-15a8866ee841f8a85f1d |
| Source of Spectrum |
DigiLab GmbH (C) 2024 |
| Synonyms |
m-Toluicacid,morpholide
(3-methylphenyl)(morpholin-4-yl)methanone |
| Technique |
GC/MS |
| Wiley ID |
DD2024_004671 |
