| SpectraBase Spectrum ID |
2XnrEAnaMQ3 |
| Name |
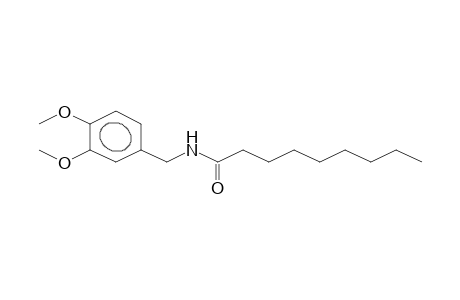
4-METHOXYNONIVAMID |
| Copyright |
Copyright © 2002-2025 Wiley-VCH GmbH. All Rights Reserved. |
| Formula |
C18H29NO3 |
| InChI |
InChI=1S/C18H29NO3/c1-4-5-6-7-8-9-10-18(20)19-14-15-11-12-16(21-2)17(13-15)22-3/h11-13H,4-10,14H2,1-3H3,(H,19,20) |
| InChIKey |
KULLVDQTQMNXKM-UHFFFAOYSA-N |
| Instrument Name |
GC |
| Molecular Weight |
307.434 g/mol |
| SMILES |
N(C(CCCCCCCC)=O)Cc1ccc(OC)c(OC)c1 |
| SPLASH |
splash10-000i-2901000000-07f1eb204c88aad28bf2 |
| Source of Spectrum |
Chemical Concepts, A Wiley Division, Weinheim, Germany |
