| SpectraBase Spectrum ID |
1EW1U7i8dHM |
| Name |
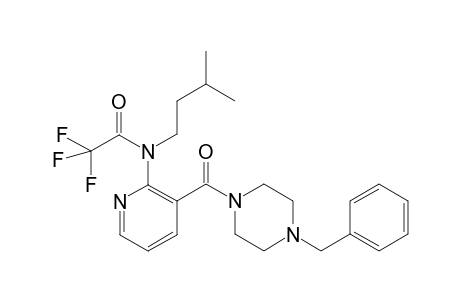
NSI-189 TFA |
| Classification |
Antidepressant |
| Copyright |
Copyright © 2023-2024 Wiley-VCH GmbH. All Rights Reserved. |
| Exact Mass |
462.224260677 u |
| Formula |
C24H29N4O2F3 |
| InChI |
InChI=1S/C24H29F3N4O2/c1-18(2)10-12-31(23(33)24(25,26)27)21-20(9-6-11-28-21)22(32)30-15-13-29(14-16-30)17-19-7-4-3-5-8-19/h3-9,11,18H,10,12-17H2,1-2H3 |
| InChIKey |
ANAQAGIFXRRJNS-UHFFFAOYSA-N |
| Ionization Type |
Electron Ionization (EI) |
| Molecular Weight |
462.517 g/mol |
| SMILES |
CC(CCN(c1c(cccn1)C(N1CCN(CC1)Cc1ccccc1)=O)C(=O)C(F)(F)F)C |
| SPLASH |
splash10-0007-7931000000-5724f21e7578063ec009 |
| Sample Comments |
The MMPW Reference Handbook and associated Tables are attached to Record #1, under the Attachments tab. Refer to these references for an explanation of the Sample Preparation Procedure "Detected" abbreviations, as well as other relevant information pertaining to this database. |
| Source of Spectrum |
H.H.Maurer, M.Meyer, K.Pfleger, A.A. Weber / University of Saarland, D-66424 Homburg Germany |
| Technique |
GC/MS |
| Wiley ID |
MMPW6e_10462 |
