| SpectraBase Spectrum ID |
15pOHPyvKkF |
| Name |
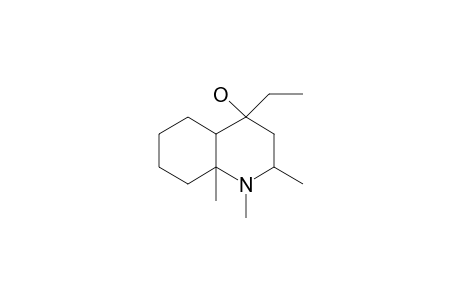
4-Ethyl-1,2,9-trimethyldecahydroquinol-4-ol |
| Comments |
Computed using SmartSpectra Model v1.42 |
| Copyright |
Copyright © 2024-2025 John Wiley & Sons, Inc. All Rights Reserved. |
| Exact Mass |
225.209264492 u |
| Formula |
C14H27NO |
| InChI |
InChI=1S/C14H27NO/c1-5-14(16)10-11(2)15(4)13(3)9-7-6-8-12(13)14/h11-12,16H,5-10H2,1-4H3 |
| InChIKey |
XXVQRBFJRRZNGP-UHFFFAOYSA-N |
| Molecular Weight |
225.376 g/mol |
| SMILES |
CCC1(O)CC(N(C)C2(C)CCCCC12)C |
| Spectrum/Structure Validation Score (Vapor Phase IR) |
0.938172 |
